


Topic 3b - Methane models and measurements
Methane is one of the most potent greenhouse gases in Earth’s atmosphere and measurements of its atmospheric concentration are vital to the monitoring of climate change.
Methane is emitted from a range of natural and anthropogenic sources. Natural sources are due to anaerobic decomposition of matter, and come from sources such as wetlands, animals, plants, and permafrost. Anthropogenic sources include agricultural livestock, land use change, rice cultivation, waste practices, coal mining, natural gas distribution, and biomass burning.
From the 1800s, to the early 1990s atmospheric methane concentrations increased annually at a rate of about 0.9%. However they “flatlined” from around 1999 to 2006, but since then have been hitting new highs. The National Oceanic and Atmospheric Administration (NOAA) has been measuring atmospheric methane concentrations in air samples from locations around the world since the early 1980s, giving scientists a picture of growth rates at different latitudes over the past 35 years. A hypothesised reason for a decline in the late 1990s to min- 2000s in the Northern Hemisphere has been attributed to industrialized countries, including the United States, gaining better control of “fugitive” methane emissions, which escape during the drilling and pumping of oil and natural gas. The rapid increase in emissions since 2006 is currently a topic of debate amongst scientists, however increased emissions from tropical wetlands are considered to be a likely source.
The SCIAMACHY sensor that was aboard the Envisat satellite performed the first space-based measurements of the global distribution of near-surface methane in 2003. Since then other satellites, such as Metop, GOSAT, and Sentinel-5p are able to take measurements of methane from space.
Featured Educators:
- Dr Anna Agusti-Panareda
Optional mini task
Visit methanelevels.org. On this page you will see an interactive graph displaying global methane measurements for the past 1000 years or so. By hovering over each section with your mouse you can find out how methane levels from that time period compare to present day levels. You can also zoom into each section by highlighting it with your mouse. There is also the added option of extending the time period to the last 800,000 years or inserting an overlay of the historical temperature record using the two icons located on the top left of the screen.
What do you notice about the growth of methane levels over time, and during specific time periods?
Don’t forget you can download the video, transcript and take any quizzes available with the links on the right.
Optional Further Reading
Interactive Apps

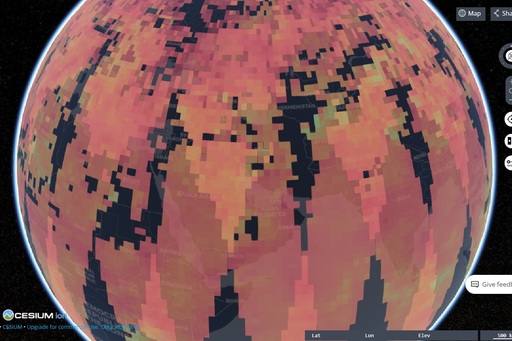
Explore global methane data in 3D with this interactive globe. Toggle the data sets on and off using the check box in the workbench located on the left side of the screen. You can also use the tools on the right side of your screen such as “toggle splitter” to view and compare different data layers at the same time. You can also change the base map and map view by clicking on the map icon on the top right of the screen

The satellites featured in this topic are as follows:
Sentinel-5p; ENVISAT; GOSAT; Metop-a; Metop-b;
You can also use the drop-down menu in the app to view these satellites.
Images

This image shows measurements collected by MAMAP on an aircraft, of a landfill site near Los Angeles emitting methane (shown in red) that is travelling with the wind. The measurements were taken during flights in in August and September 2014 as part of the COMEX campaign.
University of Bremen

This animation shows average total column Methane (CH4) in ppb, in the Pacific, from 25 to 29th March 2010. The observations are from GOSAT.
A Agusti-Panareda (ECMWF)/CAMS

This image shows Mid-tropospheric Methane (CH4) in ppb across the Pacific. Observation of CH4 were taken from IASI.
A Agusti-Panareda (ECMWF)/CAMS


In situ measurements of Methane taken at Mauna Loa, Hawaii from 1987 to 2018. The data shown in orange is preliminary.
NOAA

Measurements of methane taken from the SCIAMACHY instrument aboard Envisat from 2003-2011.
ESA